Price Increases at In n Out from 2002 to 2013
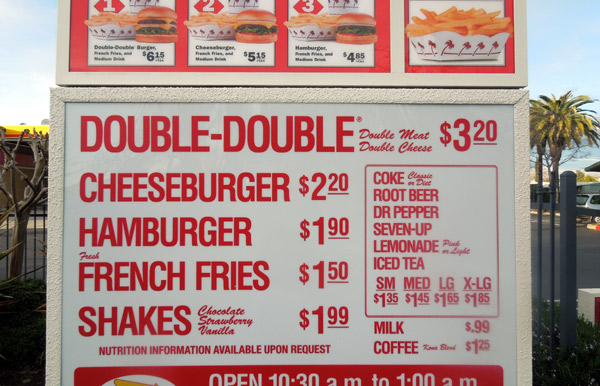
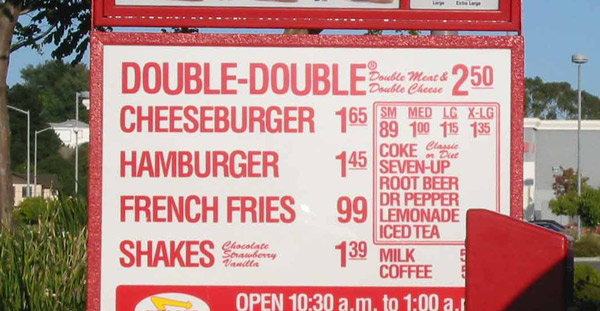
The drive-thru photos below are from 2002 and 2013. They are literally a snap shot of the food prices at In n Out, and illustrate the price increases in that time period. Please scroll down past the images to read my summary of the changes and an analysis.
Above: Entire Drive Thru Menu from 2002.

Above: Entire In n Out Drive Thru Menu from 2013.
Check it out. I think their coffee and milk used to be 50¢! The menu boards in California now usually include calorie counts. I'm not sure why In n Out Burger is exempt from that law. The menu board, other than increased prices, is almost identical to the menu from 2002. There are no photos, and the list of choices is almost exactly the same. They added dollar signs, a note about nutritional facts and re-ranked the soda flavors.
The Double Double went up 70¢, or 28%.
| In n Out Burger Double Double | |||
| 2002 Price | 2013 Price | Price Difference | % increase |
| $2.50 | $3.20 | + 70¢ | 28% |
Cheeseburgers went up 55¢
| In n Out Burger Cheeseburger | |||
| 2002 Price | 2013 Price | Price Difference | % increase |
| $1.65 | $2.20 | + 55¢ | 33% |
The French Fries went up 55¢, a 51% increase.
| In n Out Burger French Fries | |||
| 2002 Price | 2013 Price | Price Difference | % increase |
| 99¢ | $1.50 | + 51¢ | 51% |
The Sodas went up 45¢-50¢. Note the small soda is now the same price that the extra large soda used to be.
| In n Out French Fries | ||||
| Size | 2002 Price | 2013 Price | Price Change | % increase |
| S | 89¢ | $1.35 | + 46¢ | 51% |
| M | $1.00 | $1.45 | + 45¢ | 45% |
| L | $1.15 | $1.65 | + 50¢ | 43% |
| XL | $1.35 | $1.85 | + 50¢ | 37% |
These price increases are larger than I expected. I checked the Consumer Price index for this time frame, and according to their "ALL PRICES" index, I could expect an increase of 28% in prices from between 2002 and 2013 (CPI calculator at the U.S. Bureau of Labor Statistics). Only the Double Double burger increased by a figure that low.
Presumably the annual inflation figure for the Food Away from Home category is higher. Maybe even twice that high over the last 11 years.
In n Out Burger had one of the smallest percentages of price increases across their menu. Hopefully they won't read this analysis, because everyone else in the fast food game has raised their prices more than In n Out.
More Drive Thru Menu Price Comparisons:
Introduction |
McDonalds |
Taco Bell |
Carl's Jr. |
In 'n Out |
Burger King |
El Pollo Loco |
Wendys
Cockeyed home page | Contact | Terms and Conditions | Updated March 11, 2013 Copyright 2013 Cockeyed.com


