

|

|
| When I'm watching a basketball game, I want to know who is winning, and
by how many points.
Everyone I know does this little calculation in their head dozens of times while they are watching a game. Bill Walton probably keeps a pocket calculator nearby for just this purpose. The announcers declare it for the audience, "Kings up by 12", "Lakers lead by 7", but the little on-screen scoreboard never does, which I find a little disappointing.
|
|
 In
1994, I dreamed up a little chart that would illustrate the flow of an
entire basketball game by charting the difference in the scores. In
1994, I dreamed up a little chart that would illustrate the flow of an
entire basketball game by charting the difference in the scores.
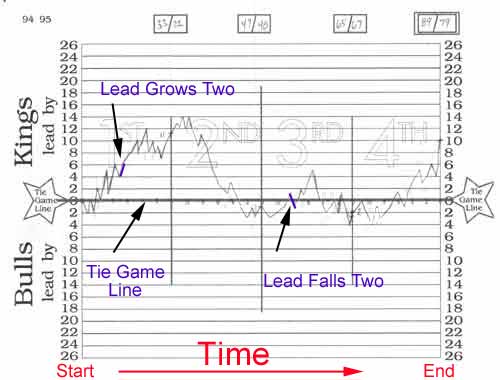
I called it the Game-O-Graph. The jagged line represents the lead over time, starting midway down on the left at zero when the game starts, and ending at 10 at the end of the game. Each basket by the Kings is represented by a little up-sloping mark, and each basket by the Bulls is represented by a little down-sloping mark. This chart tells a story: At the end of one quarter, the Kings led by 11, but by halftime, they had lost the lead, and trailed by one point. The Bulls still had the lead at the end of three quarters, but the Kings scored well in the fourth to take a 10-point lead at the end. |
|
 Here
is another example. This chart represents a Suns/Kings game from March
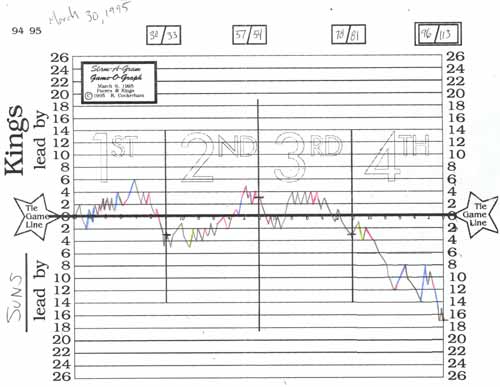
30th, 1995. Here
is another example. This chart represents a Suns/Kings game from March
30th, 1995.In this game, the line goes up and down like crazy, which means that the two teams were making baskets, keeping the scores close. Neither team could get more than a six-point lead until halfway through the fourth quarter, when the Suns finally pulled ahead with five baskets in a row. Most people enjoy this kind of game, back and forth scoring with no huge runs. I guess the Suns probably enjoyed it more than the Kings.
|
|
| Back then, the Sacramento Kings were terrible.
Mitch Richmond and Brian Grant led the team to a 39-43 regular season.
Success like that meant that most of the games were not on television.
Nevertheless I'd sit by the radio and fill out a Game-O-Graph to share
with co-workers and customers at a cafe where I worked.
The chart tended to draw particular interest after a big win. I thought so much of the Game-O-Graph idea that I sent a copy to the US Copyright office, but my application was rejected because blank forms can't be copyrighted.
|
|
 Looking
back at a big stack of old Game-o-Graphs from nine years ago, it strikes
me as a pretty big waste of time to have painstakingly filled these all
out. Then again, I don't have a stack of anything to commemorate
all the useless crap I was doing the year before that. Looking
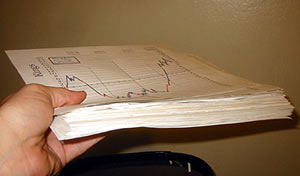
back at a big stack of old Game-o-Graphs from nine years ago, it strikes
me as a pretty big waste of time to have painstakingly filled these all
out. Then again, I don't have a stack of anything to commemorate
all the useless crap I was doing the year before that.
When I quit work at the cafe, I stopped charting games. It wasn't worth the effort if no one was going to look at the finished project. I'm giving the chart another try during the playoffs this year, and I'll be posting the charts on this site. I hope you like basketball!
|
|
Free Throws | Keon Clark Fan Page | Other incredible stuff | | Hypnodisk | The similarities between Basketball and Golf | Home | Contact Rob
April 18, 2004