

|
|

|

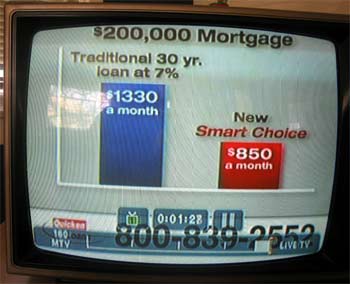
I spotted a problem on a television ad for Quicken Home Loans. I shouldn't be surprised, of course. Between the diet pill commercials and the micro-text disclaimers, it is hard to even pretend television ads are trying for accuracy. Still, this one got my attention, and so I'm going to mention it here. The ad features a bar graph illustrating the difference between $1330 and $850 per month, a 36% difference. |
|

However, the bar representing $850 a month is less than half the height of the $1330 bar. In fact, the red bar height illustrates a 54% savings.
The two bar heights are a lot easier to compare than the numbers 1330 and 850, but the bars aren't accurate.
|
|
|
Bastards at Quicken Home Loans! Someone ought to hit them in the face with a Pie Chart! In 2002, Dan Gilbert and a small group of investors purchased the Quicken Home Loans subsidiary from Intuit Software Company, and it is now privately held. This helps to explain why they didn't use Quicken to draw an accurate graph for their ad. |
|
|
Update! The graph has been fixed! |
contact Rob
science club |
other pranks |
How much is inside? |
Home |
Incredible Stuff I Made
November 30th, 2005.